UI-CUBE: An enterprise deterministic benchmark

Summarize:
Introduction
Computer Use Agents (CUAs) are an emerging class of AI systems that operate software on behalf of humans. Their promise lies in enabling automation: a CUA can, in principle, interact with any software the way a human would, by seeing, clicking, and typing, while also being able to access more app specific optimizations, API calls or workflows. This makes them a compelling candidate for scaling automation in enterprise settings, where workflows often span multiple tools and legacy systems.
However, measuring progress in CUAs remains challenging. Existing benchmarks have provided valuable information, but they face different limitations:
reliance on LLM-as-a-judge evaluation, which upper bounds the evaluation quality to the quality of the LLM judge and introduces noise in subsequent runs.
focus on non-business applications, which misses the realities of enterprise environments that are usually the repetitive and cumbersome targets to be automatized.
susceptibility to stateful noise as most benchmarks interact with applications as end-users would, without control over the underlying application state, making it impossible to guarantee identical starting conditions and evaluation across runs. As a result, small variations such as UI layout changes, random pop-ups, or background events can alter the execution environment, making both debugging and scoring inconsistent.
Our benchmark is designed to close those gaps while remaining constructive and reproducible. It provides a deterministic, enterprise-oriented evaluation framework where:
tasks start from precisely resettable states and include mechanisms for repetitive setup and state resets;
correctness is assessed from the application state itself;
See the full implementation and task suite
The benchmark is comprised of 226 tasks categorized across two main tiers - 136 simple and 90 complex - designed to expose fundamental limitations in current CUAs. Our evaluation covers:
Difficulty | Task count | Target |
Simple | 136 tasks | UI interactions |
Complex | 90 tasks | Enterprise, batch processing, copy-paste flows |
with systematic interface variation coverage, multi-resolution testing and automated validation of task success through the application state.
Beyond stability, our benchmark is diagnostic: it captures performance across dimensions such as task complexity, task type (e.g., copy, list creation, information extraction), interaction modality (buttons, sliders, pickers, etc.), and application diversity. This not only measures whether a CUA succeeds, but also reveals where and why it struggles, providing actionable insights to accelerate progress toward enterprise-grade automation.
Task design
Our design targets two primary failure modes observed in current systems: interface adaptation across UI variations and workflow coordination in multi-step processes. All tasks are evaluated across multiple screen resolutions to assess agent consistency under different display conditions.
UI-CUBE Jr.: Simple task scenarios
The simple tier, comprising 136 tasks, is designed to maximize interface diversity while isolating the interactive elements a CUA would typically engage with when completing a task.

Control distribution emphasizes interactive elements: buttons (22.4%), selection controls (16.5%), text inputs (13.2%), and menus (6.6%). Calendar (8.1%) and date input controls (6.8%) together receive notable coverage due to their temporal complexity across 20 distinct implementations including analog clocks and timezone-aware selections.
Control Category | Interaction Patterns | Count | Key Variations Tested |
|---|---|---|---|
Combo Box Tasks | Autocomplete, browse-heavy, token-based, command palettes | 20 | Fuzzy matching, async validation, progressive disclosure, multi-selection |
Date Picker Tasks | Calendar pickers, range selection, preset buttons | 20 | Modal vs inline, multi-date selection, business rules, timezone handling |
Time Picker Tasks | Clock faces, dropdowns, sliders, duration controls | 20 | 12/24-hour formats, timezone coordination, recurring patterns, accessibility |
Input Form Tasks | Multi-step forms, validation, specialized inputs | 20 | Real-time validation, conditional fields, drag-drop, payment forms |
Navigation: Lists & Tables | Pagination, sorting, filtering, virtualization | 20 | Infinite scroll, sticky headers, grouping, responsive layouts |
Navigation: Hierarchical & Spatial | Trees, menus, breadcrumbs, tabs, carousels | 20 | Expansion states, nested navigation, spatial orientation, focus management |
Navigation: Search & Interaction | Spatial controls, keyboard shortcuts, command interfaces | 16 | Map interaction, grid navigation, modal management, anchor links |
Total | 136 |
Rather than sampling interface patterns randomly, we target specific interaction challenges. Date/time controls prove particularly demanding, with implementations spanning digital inputs, analog displays, and timezone conversion logic. Combo box interactions receive focused attention through 20 archetypes testing autocomplete-first designs, browse-heavy dropdowns, and token-based multi-selection patterns.
We stress-test interface tensions across fundamental interaction patterns: precision vs. convenience in numeric inputs (steppers vs. sliders vs. range controls), browsing vs. searching in dropdown controls (autocomplete-first vs. browse-heavy vs. token-based designs), and freedom vs. guidance in form progression (sequential unlocking vs. free navigation, open inputs vs. constrained selections). Existing benchmarks evaluate narrow interface slices; our systematic coverage exposes generalization limits across the full spectrum of common controls.

Structure distribution reveals the layout complexity agents must navigate. Forms (14.6%) and tables (14.2%) dominate, reflecting the prevalence of data entry and tabular manipulation in enterprise workflows. Modals (9.6%) and custom designs (8.8%) follow, testing adaptation to layered or unconventional layouts. Trees (5.79%), menus (6.5%), and lists (4.6%) capture hierarchical and sequential navigation. Error states (2.7%) and pre-filled contexts (2.3%) test recovery and context-awareness capabilities within persistent UI environments.

Action distribution patterns expose the motor complexity of realistic automation. Selection remains most frequent (23%), followed by navigation (16.1%), typing (11.1%), and scrolling (9.2%). Extraction actions (8.6%) and visual search (5%) expand coverage of perceptual and data-handling tasks, while JSON formatting (4%) and filtering (3.8%) introduce structured manipulation challenges. Expansion (2.1%), dragging (3.3%), and toggling (1.5%) cover rare but critical behaviors. This broader spread indicates a balanced distribution between mechanical selection and cognitive transformation tasks.
UI-CUBE complex task scenarios
Complex scenarios are broken down in 50 tasks covering copy-pasting and iteration, and another 40 tasks covering legacy enterprise apps.
Copy-Paste and Iteration, Bridging Atomic Actions and Workflow Complexity
Activity Type | Count | Examples |
|---|---|---|
Copy-Paste Tasks | 40 | |
Data Aggregation & Collection | 7 | Contact details from tables, quarterly sales compilation, calendar meetings, medical lab results, appointment scheduling |
Filtering & Search | 6 | Product catalog browsing, urgent task compilation, inventory analysis, library catalog search, electronics filtering |
Content Analysis & Validation | 6 | Invoice analysis, spam detection, survey counting, resource conflicts, document diff review, accessibility audit |
External Reference & Form Processing | 9 | Customer registration wizard, service tickets, library cataloging, student enrollment, tenant application, loan application |
Classification & Rule-Based Processing | 6 | Product configuration validator, code review resolution, service taxonomy mapping, design annotation validation |
Data Manipulation | 3 | Salary updates, Kanban ticket management, social media scheduling |
Navigation & Exploration | 3 | File tree PDF collection, org chart traversal, menu hierarchy mapping |
Business Process Tasks | 10 | |
Error Recovery & Batch Processing | 2 | Connection timeout handling, file access with error navigation |
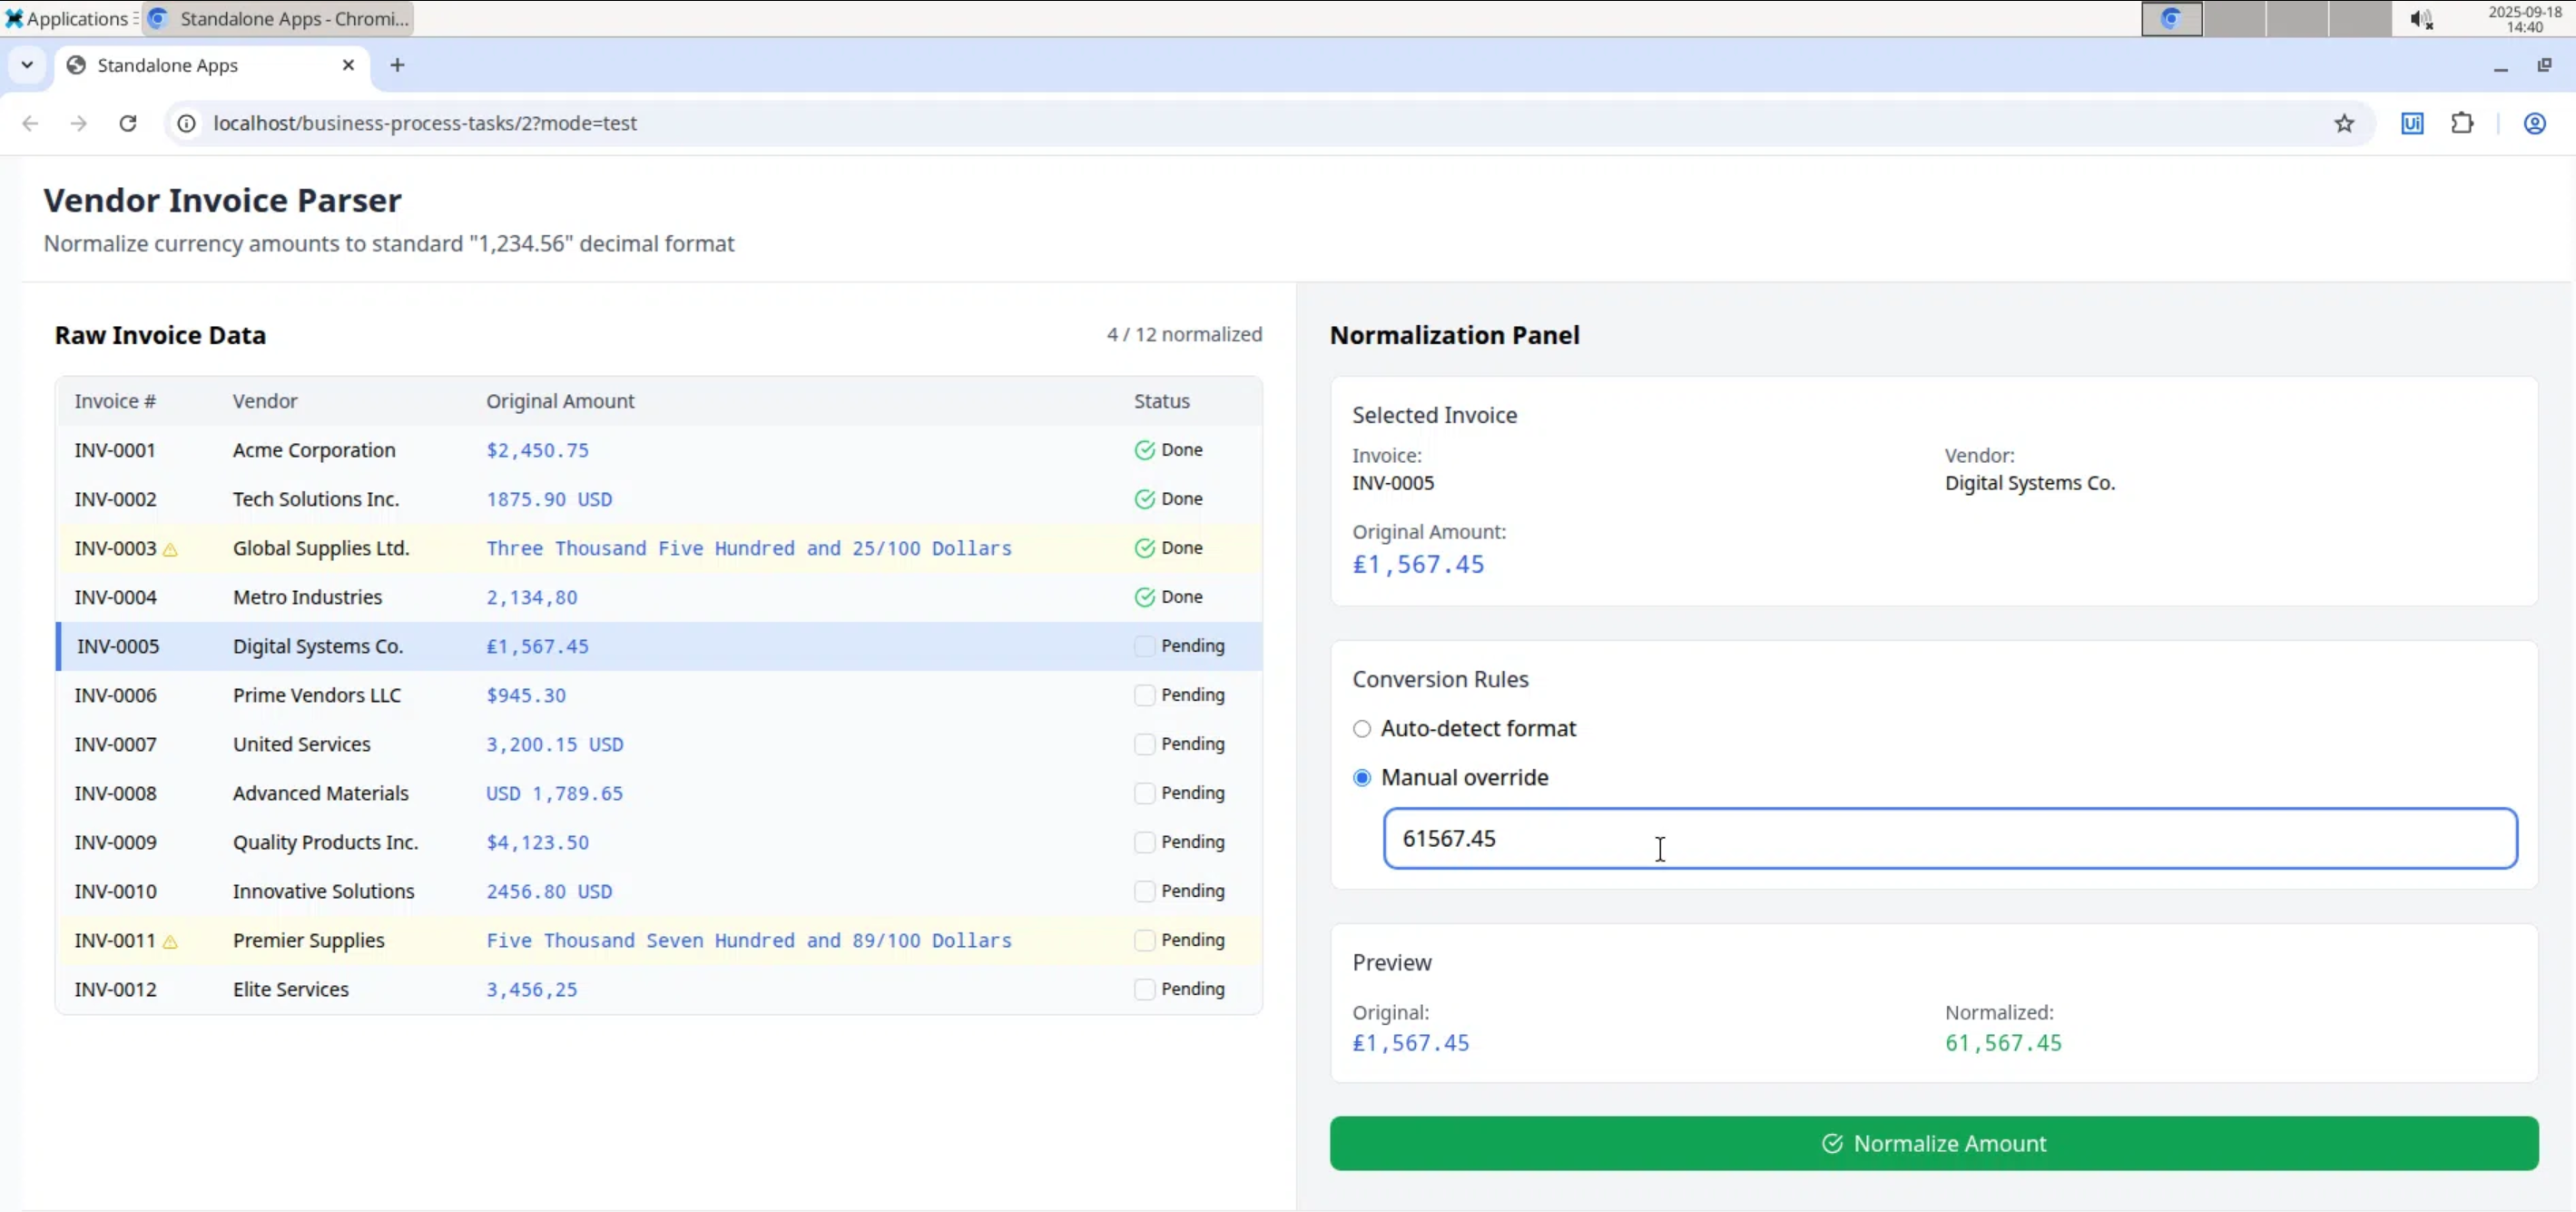
Data Quality & Transformation | 2 | Currency normalization, customer deduplication |
Form Management & Data Entry | 3 | Accordion form completion, multi-step transport form, paginated table extraction |
Compliance & PII Management | 1 | Customer record anonymization |
Application Review | 1 | Graduate school application assessment |
Directory Analysis | 1 | Transport company fleet counting |
Total | 50 |
The complex tier, totaling 90 tasks, bridges atomic actions and workflow complexity. Action patterns shift toward coordination: navigation increases relative to simple selection, with substantial scrolling (7.3%) and filtering (3.0%) requirements. Structure distribution emphasizes data-heavy layouts: tables (8.8%), hierarchical trees (7.2%), and complex custom designs (18.4%).
Tasks require synthesizing information across sources: Excel-to-form mapping, quarterly sales compilation, and organizational chart navigation. Memory challenges emerge naturally—agents must track processed items, maintain running totals across pagination, and avoid duplicate selections while navigating complex interfaces.
Our design centers on three cognitive challenges that separate effective agents from brittle automation scripts. Aggregation and correlation patterns require agents to synthesize information across multiple sources while maintaining relationships between disparate data points—collecting contact details from scattered table rows, correlating quarterly sales figures across separate databases, or extracting director-level employees from organizational charts based on hierarchical position.
Conditional execution logic appears throughout tasks requiring rule-based reasoning within interactive contexts: updating salaries for employees hired before specific dates, scheduling social media posts exceeding engagement thresholds, or flagging document changes against compliance rules. Memory and state management challenges test whether agents can maintain working context across extended interactions: tracking which invoices have been processed while navigating pagination, remembering expansion states in hierarchical trees, or avoiding duplicate item selection during systematic interface exploration.
Business logic appears throughout: temporal filtering (employees hired before 2020), performance thresholds (social media posts with >100 likes), and compliance validation (document changes against style guides). Implementation scales appropriately: simple tasks require ~100 lines of code, copy-paste scenarios demand ~400 lines to model realistic data relationships.
The remaining 40 complex tasks simulate authentic enterprise workflows across five major business applications:
Enterprise Applications: Authentic Workflow Simulation
Application | Count | Primary Workflows | Complexity Areas |
|---|---|---|---|
Salesforce (CRM) | 8 | Lead management, activity tracking, bulk operations | Multi-step lead creation, cross-record activity transfers, search/sort/filter operations, bulk status updates |
SAP Stock Overview (ERP) | 8 | Inventory management, material lookup, stock analysis | Complex filtering with multiple criteria, hierarchical data navigation, cross-plant material tracking |
Concur (Expense Management) | 8 | Expense reporting, receipt attachment, vendor management, flight booking | Multi-step report creation, document attachment workflows, conditional business logic, travel search interfaces |
Workday (HR Management) | 8 | Time-off requests, contact management, personal information updates | Date range selection, hierarchical menu navigation, form validation workflows |
Kanban Board (Project Management) | 8 | Issue tracking, status management, project coordination | Task lifecycle management, drag-drop operations, view switching, data extraction |
Total | 40 |
Enterprise scenarios reproduce selected workflows from major applications such as Salesforce, SAP, Workday, Concur, and Kanban systems. Structure distribution reflects enterprise complexity: forms (14.7%) and tables (14.3%) define the core layout, while custom designs (8.9%), modals (9.7%), and error states (2.7%) capture the irregular conditions common in enterprise software.
Application mocking preserves essential complexity by reproducing authentic business workflows and enterprise UI patterns while maintaining reproducibility. Each mocked workflow incorporates realistic domain logic: multi-step approval processes, conditional form validation, and hierarchical data navigation. Implementation cost scales primarily with application architecture rather than individual task complexity—substantial codebases (2000–4000 lines per application) reflect enterprise software’s inherent UI and state management requirements, while individual tasks typically require 100–300 lines including validation and guidance systems. This architecture enables testing both simple operations (lead creation, data lookup) and complex multi-step workflows (expense report creation with attachments) within the same realistic enterprise context. The benchmark’s strength lies in capturing selected enterprise workflows for agent evaluation rather than artificially inflating task difficulty.
Evaluation
The evaluation methodology uses execution-based, programmatic checkers over application state rather than trajectory-based or LLM judges, ensuring deterministic, replayable, and robust assessments. Each task defines a test() function that inspects window.app_state or structured JSON, returning success or failure based on precise assertions of application state, eliminating brittleness from UI variations.
Validation is tiered by task complexity:
Simple tasks – exact equality checks on interface states (buttons, form fields, navigation).
Intermediate tasks – batch processing and structured data submission (copy-paste scenarios) with exact matches on strings, arrays, and counts.
Enterprise workflows – complex, long-horizon processes requiring state persistence, error recovery, and semantic correctness with controlled leniency (e.g., regex normalization, order-independence).
The approach balances strict correctness with operational robustness, using normalization and semi-fuzzy checks where appropriate, ensuring deterministic and auditable evaluation across tasks. Implementation scales predictably across tiers, and separating validation logic from interface code ensures consistent scoring despite UI changes or resolution differences, addressing common sources of noise in prior benchmarks.
Multi-resolution testing
All tests execute across three enforced resolutions: 1024×768, Full HD, and 4K, reflecting real-world deployment variability. This addresses environmental brittleness, a failure mode typically overlooked in existing benchmarks.
Our empirical distributions ground the benchmark in realistic interaction patterns while enabling systematic evaluation of agent capabilities across the complete spectrum of enterprise interface complexity.
Error analysis
Our analysis of agent performance across enterprise applications showed several sources of failure:
Lack of internal knowledge about application
Interface Ambiguity: Agents frequently fail to identify the correct navigation icon or correct menu item, particularly when this requires prior knowledge of the interface or exploratory actions such as hovering over elements. This will be particularly true for unpopular applications, where the meaning of different ui elements (particularly buttons with icon and no text label) is not known before.
Grounding errors
Coordinate issues: Grounding models sometimes produce small coordinate misalignments even when the target UI element is simple to locate, leading to execution failure.
Occlusion: Partial visibility of interface elements (element occlusion) often prevents accurate selection.
Reasoning errors
Long execution context: many enterprise dynamic or iterative tasks involve repetitive procedures applied to multiple items, and agents often lose track of progress within the sequence, either repeating prior steps or omitting elements entirely.
Unexpected UI changes: Agents often become stuck when encountering unexpected user interface behavior, particularly when the canonical execution path is unavailable. While exploration is sometimes necessary to recover from such situations, agents lack robust strategies for safe exploration, i.e., exploring without performing potentially irreversible actions.
Scrolling down bias: sometimes in the middle of the execution, the relevant content requires upward navigation while the agents only try scrolling down.
Hallucination
Content hallucinations: Agents introduce content that doesn’t reflect the source or intended task.
In copy-paste workflows, agents “correct” or reformat inputs, altering their meaning.
In form-filling tasks, when fields are left empty, agents may invent plausible but spurious values rather than preserving emptiness.
Error examples
Agent miss-click the expander button:

Agent miss-click the expander button
Agent incorrectly reads the text from the list :
Agent incorrectly reads the text from the list
Agent gets stuck in a loop:


Results and evaluation
For now we focused our evaluation on image based agents only. So we evaluated the benchmark on three different image based agents:
Claude Computer Use 4.0
OpenAI-computer-use-preview
UIPathScreenAgent
Claude Computer Use and OpenAI computer use are two state of the art end-to-end computer use agents.
Our Computer Use agent is a standard two stage architecture:
Planner - a typical large language model, generating action sequences, reasoning about task goals and observing modifications in the environment.
Grounder - which translates string actions into screen coordinates and an action type. In our case the grounder wraps UI-TARS-7b with the UIPath computer vision model to perform crop-and-refine grounding predictions
The evaluation was performed across 3 resolutions: XGA, 1080p and 4k, with each agent given max 50 steps.
Model | Simple Tasks | Complex Tasks |
|---|---|---|
Claude Computer Use 4.0 | 66.67% | 8.71% |
OpenAI-computer-use-preview | 70.34% | 10.44% |
UIPathScreenAgent/Gemini 2.5 Flash | 68.63% | 12.19% |
UIPathScreenAgent/GPT 5 mini | 76.96% | 16.97% |
UIPathScreenAgent/GPT 5 | 84.8% | 17.41% |

We observed that screen resolution has a non-trivial impact on agent performance in our benchmark. As resolution increases, agents exhibit a higher frequency of grounding errors, often predicting incorrect element positions due to the larger action space. At the same time, higher resolution can reduce the need for exploratory actions in certain tasks, as more interface elements are visible simultaneously. Despite this potential benefit, the overall effect of increased resolution is a degradation of performance, suggesting that current agents struggle to generalize their perception and grounding mechanisms across different screen scales.
Model | Simple XGA | Complex XGA | Simple 1080p | Complex 1080p | Simple 4K | Complex 4k |
|---|---|---|---|---|---|---|
Claude Computer Use 4.0 | 88.97% | 10.45% | 73.53% | 11.75% | 37.5% | 3.92% |
OpenAI-computer-use-preview | 91.18% | 11.75% | 84.56% | 15.67% | 35.29% | 3.92% |
UIPathScreenAgent/Gemini 2.5 Flash | 84.56% | 7.84% | 82.35% | 15.67% | 38.97% | 13.06% |
UIPathScreenAgent/GPT 5 mini | 90.44% | 14.37% | 88.97% | 20.90% | 51.47% | 15.67% |
UIPathScreenAgent/GPT 5 | 94.12% | 15.67% | 91.18% | 26.14% | 69.12% | 10.45% |

Influence of resolution on simple tasks

Influence of resolution on complex tasks
Human evaluation results
To establish a baseline for human performance on our benchmark, we conducted comprehensive human evaluations across all task collections. Human evaluators with no prior experience with the benchmark applications were given task instructions and asked to complete them manually through the web interface.
The results reveal striking performance differences between task categories:
Collection | Human Accuracy (%) | Avg. Duration (s) | Avg. Steps |
|---|---|---|---|
combo-box-tasks | 100.00 | 10.99 | 4.05 |
date-pickers | 100.00 | 15.30 | 7.15 |
time-pickers | 100.00 | 9.53 | 6.00 |
input-boxes | 90.00 | 20.62 | 11.30 |
navigation-lists-tables | 95.00 | 6.75 | 4.25 |
navigation-hierarchical-spatial | 100.00 | 2.87 | 2.05 |
navigation-search-interaction | 100.00 | 8.74 | 4.25 |
kanban-board | 100.00 | 12.50 | 3.75 |
business-process-tasks | 50.00 | 267.16 | 75.40 |
concur | 50.00 | 130.36 | 34.12 |
copy-paste-tasks | 53.33 | 177.72 | 72.87 |
salesforce | 62.50 | 122.48 | 55.50 |
sap-stock | 50.00 | 183.27 | 33.62 |
workday | 62.50 | 42.82 | 14.25 |
Easy vs Complex Tasks Summary
Task Type | Total Tasks | Human Accuracy (%) | Avg. Duration (s) |
|---|---|---|---|
Easy Tasks | 136 | 97.9 | 10.7 |
Complex Tasks | 90 | 61.2 | 149.2 |
The human evaluation results demonstrate near-perfect performance (97.9%) on simple tasks, with most interface interactions completed in under 11 seconds. However, the 90 complex tasks reveal significant challenges even for human users, with only 61.2% accuracy achieved.
Several factors contribute to the lower performance on complex tasks:
Task Description Complexity: Complex tasks often involve multi-step workflows with intricate business logic, requiring careful reading and comprehension of detailed instructions that span multiple operations and conditional requirements.
Manual JSON Formatting: Many complex tasks require users to construct and format JSON objects manually, a process prone to syntax errors and requiring precise attention to data structure requirements.
Long Execution Sequences with Strict Validation: Complex tasks typically involve 150+ steps followed by strict validation criteria. A single mistake at any point invalidates the entire execution, creating high-stakes scenarios where users must maintain perfect accuracy throughout extended interactions.
Lack of Prior Application Experience: Evaluators had no previous experience with enterprise applications like Salesforce, SAP, or Workday, requiring them to learn unfamiliar interfaces and workflows on-the-fly while under evaluation pressure.
These human baseline results establish that the 61.2% accuracy on the 90 complex tasks represents a realistic ceiling for current AI systems operating in enterprise environments, particularly when dealing with unfamiliar applications and multi-step workflows requiring sustained attention and precise execution.
Topics:
Agentic orchestration
Principal Applied Scientist, UiPath
Related articles


Get articles from automation experts in your inbox
Sign up today and we'll email you the newest articles every week.
Thank you for subscribing!
Thank you for subscribing! Each week, we'll send the best automation blog posts straight to your inbox.
Get articles from automation experts in your inbox
Sign up today and we'll email you the newest articles every week.
Thank you for subscribing!
Thank you for subscribing! Each week, we'll send the best automation blog posts straight to your inbox.